"Emails show [Chris Cristie]'s aides did plan bridge gridlock," says Salon. To a transportation engineer, the aides are innocent: bridges can't have gridlock. While we often say "gridlock" to mean "bad traffic," it has a technical meaning.

Gridlock occurs when a queue from one bottleneck makes a new bottleneck in another direction, and so on in a vicious cycle. Below, to see gridlock: click the Play button and push the arrival rate past 40. Gridlock starts when a queue blocks a ramp (colored block). Play around with the arrival rate and trip lengths (how many ramps a car travels before it exits).
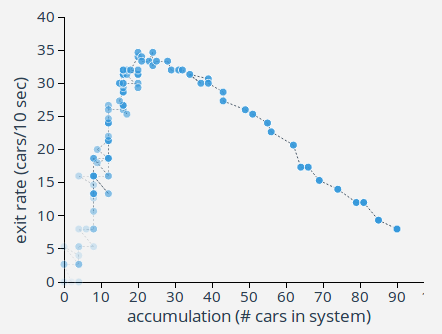
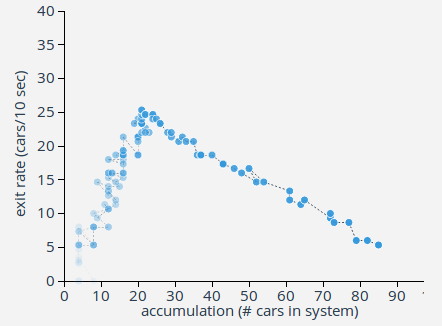
The System Performance plot shows the system's exit rate (the rate vehicles reach their destinations) vs. accumulation (# of cars on the road) at different moments. For a given trip length, the dots will cluster around a curve called the Network Exit Funtion (NEF). I made the graphs below by slowly turning up the arrival rate from 0.
Trip Length = 2 ramps
Trip Length = 3 ramps
The right branch of the NEF represents hypercongestion, where the exit rate keeps falling and the network fills up. Once hypercongestion sets in, delaying arrivals can let more people exit on time. That's not true of a bottleneck.
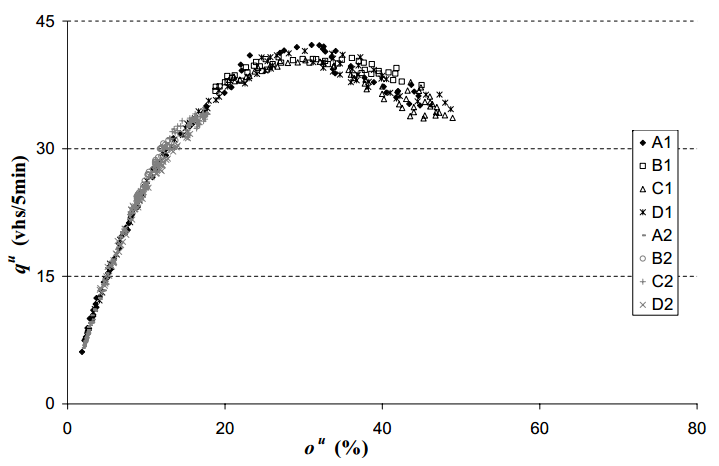
The NEF matters for two reasons. First, with mobile data and wireless links to infrastructure it will be possible to gently control accumulation in real-time via traffic signals and ramp meters—that is, by making temporary bottlenecks we can solve gridlock. Second, you don't need to know what's happening everywhere to get a reliable picture...a sort of "fast and frugal" technique. Nor is this just theory. Below is a plot from Yokohama. Its right branch is short because gridlock doesn't really get as bad as in our simulation.
To learn more about traffic flow theory, check out the Wikibook Fundamentals of Transportation. For an interactive explanation of the nitty gritty physics/psychology of congestion: What are traffic waves?. This simulation was based on this old one.
—Lewis Lehe works on transportation economics as a transportation engineering PhD student at UC Berkeley.