With data visualization we have a tendency to ask "what value does this add?" But we shouldn't forget a data visualization that offers us no new insight or knowledge can still offer value. It can be elegant or thought-provoking. Just as there is art for art's sake, maybe there can be data visualization for its own sake, too.

Recently, I learned how to operate a laser cutter. It's been a whole lot of fun, and I wanted to share my experiences creating woodcut data visualizations using just D3.
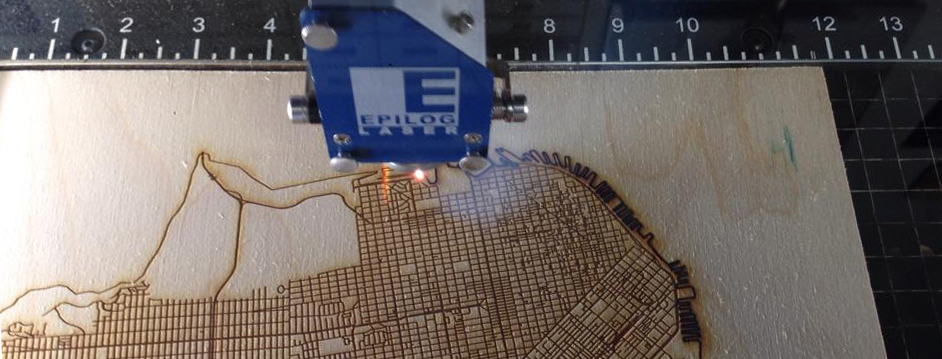
Laser cutting and etching works well with Scalable Vector Graphics (SVG). The format makes it easy to specify paths the laser can follow when cutting. It also makes it easy to scale up your design for larger surfaces when cutting or etching. The design above is of San Francisco and started out a pair of GIS shapefiles. One of the streets of San Francisco used for the etching and another of the outline of the bay used for cutting out the city boundary/coastline. To convert the shapefiles to a format that JavaScript can read, I used ogr2ogr to convert them to GeoJSON with the following command:
ogr2ogr -t_srs EPSG:4326 -f GeoJSON data.json stclines_streets.shpFor a longer introduction to using ogr2ogr and GeoJSON, check out Mike Bostock's excellent Let's make a map. For me, the important part was adding -t_srs EPSG:4326 to convert the shapefile format to latitude and longitude coordinates (Not all shapefiles use latitude and longitude coordinates by default.)
The next major step was making an SVG map out the GeoJSON file. For this, I used D3's d3.geo.mercator generator which uses a Mercator projection to translate latitude and longitude to x and y pixel coordinates. Here's the code below:
var projection = d3.geo.mercator()
  .scale(100000) // aka, "zoom"
  .center([37.78,-122.42].reverse()) // Google gives the coordinates flipped.
  .translate([width / 2, height / 2]) // Center the map in the middle of the screen.
[37.78, -122.42] is the latitude and longitude geographic center of San
Francisco. I found this by using Google maps to pin point San Francisco and then
inspected the URL.
https://www.google.com/maps/place/San+Francisco,+CA/@37.759617,-122.4458183,15z
The latitude and longitude is right after the @.
With a handful of other D3 commands, I ended up with the following:
To save the resulting SVG to a file that could be fed into the laser cutter, I used SVG Crowbar, then opened the file in Adobe Illustrator to remove some of the extra borders not running along the San Francisco city limits.
The laser printer will read any path in the SVG as a cut or an etch. To designate a path as a cut on the laser printer I used, I set the path thickness to 0.001 for the city boundary. It was also important to calibrate the power settings to properly cut and etch my 1/4 inch plywood.
Laser cutters interface with computers just like regular printers. They usually require special drivers, but any laser cutter you'll be accessing will likely be pre-configured for you. Assuming you already have a design, the process usually goes something like this:
- Open your design in Adobe Illustrator.
- Open the printing preferences to configure the job, telling the laser things like what types of power settings it should use, etc.
- Click "print" to have the job sent to the laser for processing.
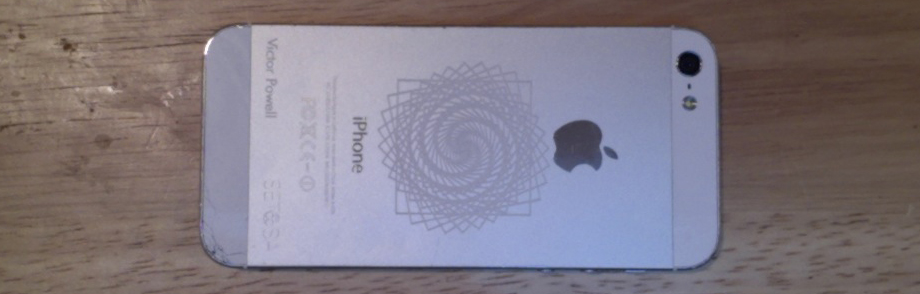
In addition to the map, I also etched the design below into my iPhone. It's not a data visualization, but it looks cool, and I was able to make with D3.
Here's the code that generated the above design.
var width = window.innerWidth, height = window.innerHeight
var w = 400, h = 400, n = 40

var svg = d3.select('body').append('svg')
  .attr({width: width, height: height})

var data = d3.range(n)
  .map(function(d) { return (d + 1) / n / 2 })
  .sort(function(a, b){ return b - a })

var g = svg.selectAll('g').data(data)
  .enter().append('g')
    .attr('transform', function(d) {
      return 'translate(' + [ width / 2, height / 2 ] + ') rotate(' + d * 900 + ')'
     })

g.append('rect')
  .style({fill: 'none', stroke: 1 })
  .attr('x', function(d) { return - w * d * 0.5 })
  .attr('y', function(d) { return -h * d * 0.5 })
  .attr('width', function(d) { return w * d })
  .attr('height', function(d) { return h * d })
And here's the final result.
If you'd like to laser cut your own data visualizations, several community hacker spaces offer access to laser cutting equipment. If you live in San Francisco, Pittsburgh, and a few other places, you already live near a laser cutter inside a TechShop.
D3 is an incredible library and it enabled the creation of so much more then just data visualization. It can also create beautiful physical objects outside of computer screens.
![]()